

Measure to manage
Because you can’t improve what you can’t measure.
Accelerate the decision-making process, help business managers to make informed decisions about the business by presenting accurately, easy to read and understand reports and dashboards that display the information that is important.

Because you can’t improve what you can’t measure.
Monitoring and measuring workflow steps give precise insights into the efficiency of operations. Measuring process performance increases accountability in the organisation and helps spotting bottlenecks and improvement areas. Dashboards provide a broad perspective to the organisation by analysing the processes and the data.
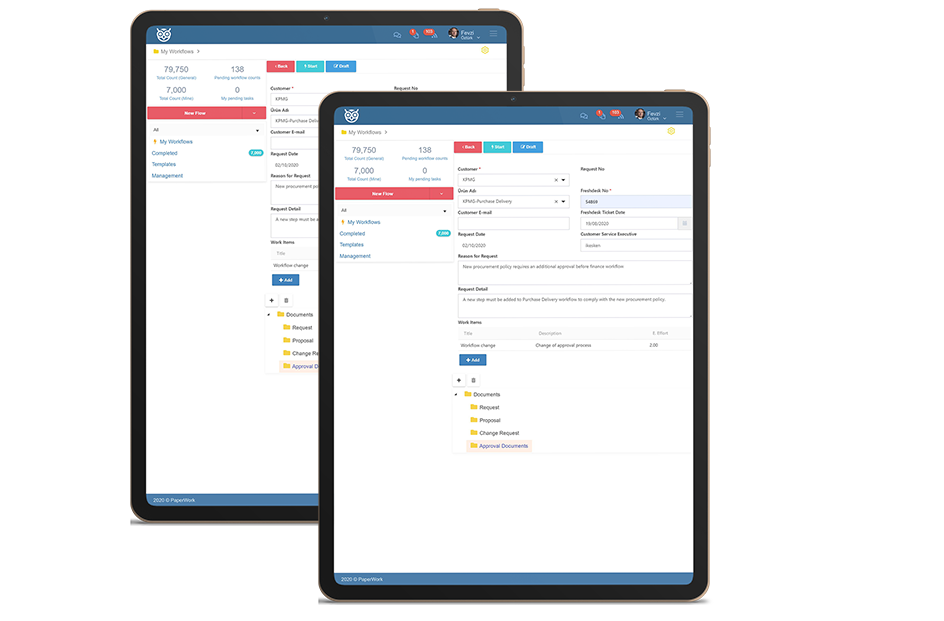
360-degree view of processes
Create a 360-degree view of processes and data to make quick and informed decisions with beautifully designed, real-time, data-driven dashboards.
Easily create a graphical representation of your data that contains what is important and meaningful for you and your business without getting lost in detail.
Visual Report Designer for business users
A unified and full-featured designer for dashboards and reports, which includes a wide variety of wizards and ad hoc editors to simplify the creation and modification of reports.
Create and view reports, analyse data, work with dashboards, and export reports to PDF, Excel, Word etc., in a few clicks using the Visual Report Designer, which does not require any programming skills.
6698 sayılı Kişisel Verilerin Korunması Hakkında Kanun (“KVKK”) uyarınca, GG Soft Yazılım Hizmetleri A.Ş. (“PaperWork”) olarak, veri sorumlusu sıfatıyla,
Online iş başvurusu yapacak olan çalışan adaylarımızın kişisel verilerini aşağıda açıklanan amaçlar kapsamında; hukuka ve dürüstlük kurallarına uygun bir şekilde işleyebilecek, kaydedebilecek, saklayabilecek, sınıflandırabilecek, güncelleyebilecek ve mevzuatın izin verdiği hallerde ve/veya işlendikleri amaçla sınırlı olarak 3. kişilere açıklayabilecek/aktarabileceğiz.
Başta KVKK mevzuatı olmak üzere ve ilgili mevzuat kapsamında, online iş başvurularında PaperWork ile paylaştığınız / paylaşacağınız kimlik, iletişim, askerlik durumu, mesleki deneyim, eğitim, görsel ve işitsel kayıtlara dayalı kişisel verileriniz, çalışan adaylarının başvuru süreçlerinin yürütülebilmesi, insan kaynakları faaliyetlerinin mevzuata uygun yürütülmesi, saklama ve arşiv faaliyetlerinin yürütülebilmesi ve sonuçlanabilmesi amacıyla işlenebilecektir. Bu kapsamda bahsi geçen kişisel verileriniz, işlenme amacıyla uygun süre zarfında fiziksel veya elektronik ortamda güvenli bir şekilde saklanmaktadır.
PaperWork tarafından kişisel verilerin korunmasına ilişkin olarak KVKK başta olmak üzere ilgili tüm mevzuatta öngörülen yükümlülüklere uygun hareket edilmektedir.
Online iş başvurusu ile elde edilen kişisel veriler; Kanunun 5. Maddesinde belirtilen;
Bir sözleşmenin kurulması veya ifasıyla doğrudan doğruya ilgili olması kaydıyla, sözleşmenin taraflarına ait kişisel verilerin işlenmesinin gerekli olması,
Veri sorumlusunun hukuki yükümlülüğünü yerine getirebilmesi için zorunlu olması,
Bir hakkın tesisi, kullanılması veya korunması için veri işlemenin zorunlu olması,
İlgili kişinin temel hak ve özgürlüklerine zarar vermemek kaydıyla,
veri sorumlusunun meşru menfaatleri için veri işlenmesinin zorunlu olması,
“İlgili kişinin rızası” hukuki sebeplerine dayalı olarak otomatik yolla işlenmektedir.
Açıklanan amaçlar kapsamında işlenen yine yukarıda belirtilen kişisel verileriniz; KVKK’da öngörülen temel ilkelere uygun olarak çalışan adayı seçme ve yerleştirme süreçlerinin yürütülmesi amacıyla 1. Maddede belirtilen PaperWork ile ürün ve hizmet alıcılarına aktarılabilecektir.